Introduction
The quality requirements for injection molded products are increasing, especially for automotive or telecommunication products. Their mechanical properties, dimensional accuracy and appearance improved greatly through the years thanks to the more accurate injection molding machines, molds, and more special polymers on the market. One of the cornerstones of the continuous production of good quality products is the correctly set injection molding technology. Of course, the machine setting not only means the parameters of the injection cycle, but the correct preparation and drying of the raw material, the tempering of the mold and other settings. It makes the reproducibility of production difficult when we work with multi cavity mold due to the different filling of the cavities. To test the reproducibility and stability of the technology we can use the monitoring tools of the injection molding machine. This method is more or less effective, but it has its limits since we do not measure the parameters where the forming happens so confounding factors limit the reliability of monitoring. Cavity pressure measurement is the only technique that gives a closed feedback for system operation. Switchover based on cavity pressure increases the system stability, product separation based on the pressure curves – by setting correct tolerances – ensures scrap-free production, storing the measured values provides quality control and traceability. Unfortunately, these systems are not widespread in the industrial environment, therefore at the GAMF Faculty of Kecskemét College we developed a new cavity pressure measurement system, which opens new possibilities for the users. In our article we show the potential of the measurement system with the help mold of thick-walled product from a practical point of view.
Experiment
For the tests we used the Tipelin R-959A (TVK Nyrt.) type of polypropylene, which is recommended for injection molding, and has low viscosity, and its flow index is 45g/10 min measured on 230°C and at a load of 2,16 kg.
The experiments were performed on an ARBURG Allrounder 470A injection molding machine with monitoring system. During the testing/production process the electronic data carrier continuously stores the measured values (injection pressure, injection time etc.), so they can be quite easily and quickly analyzed later.
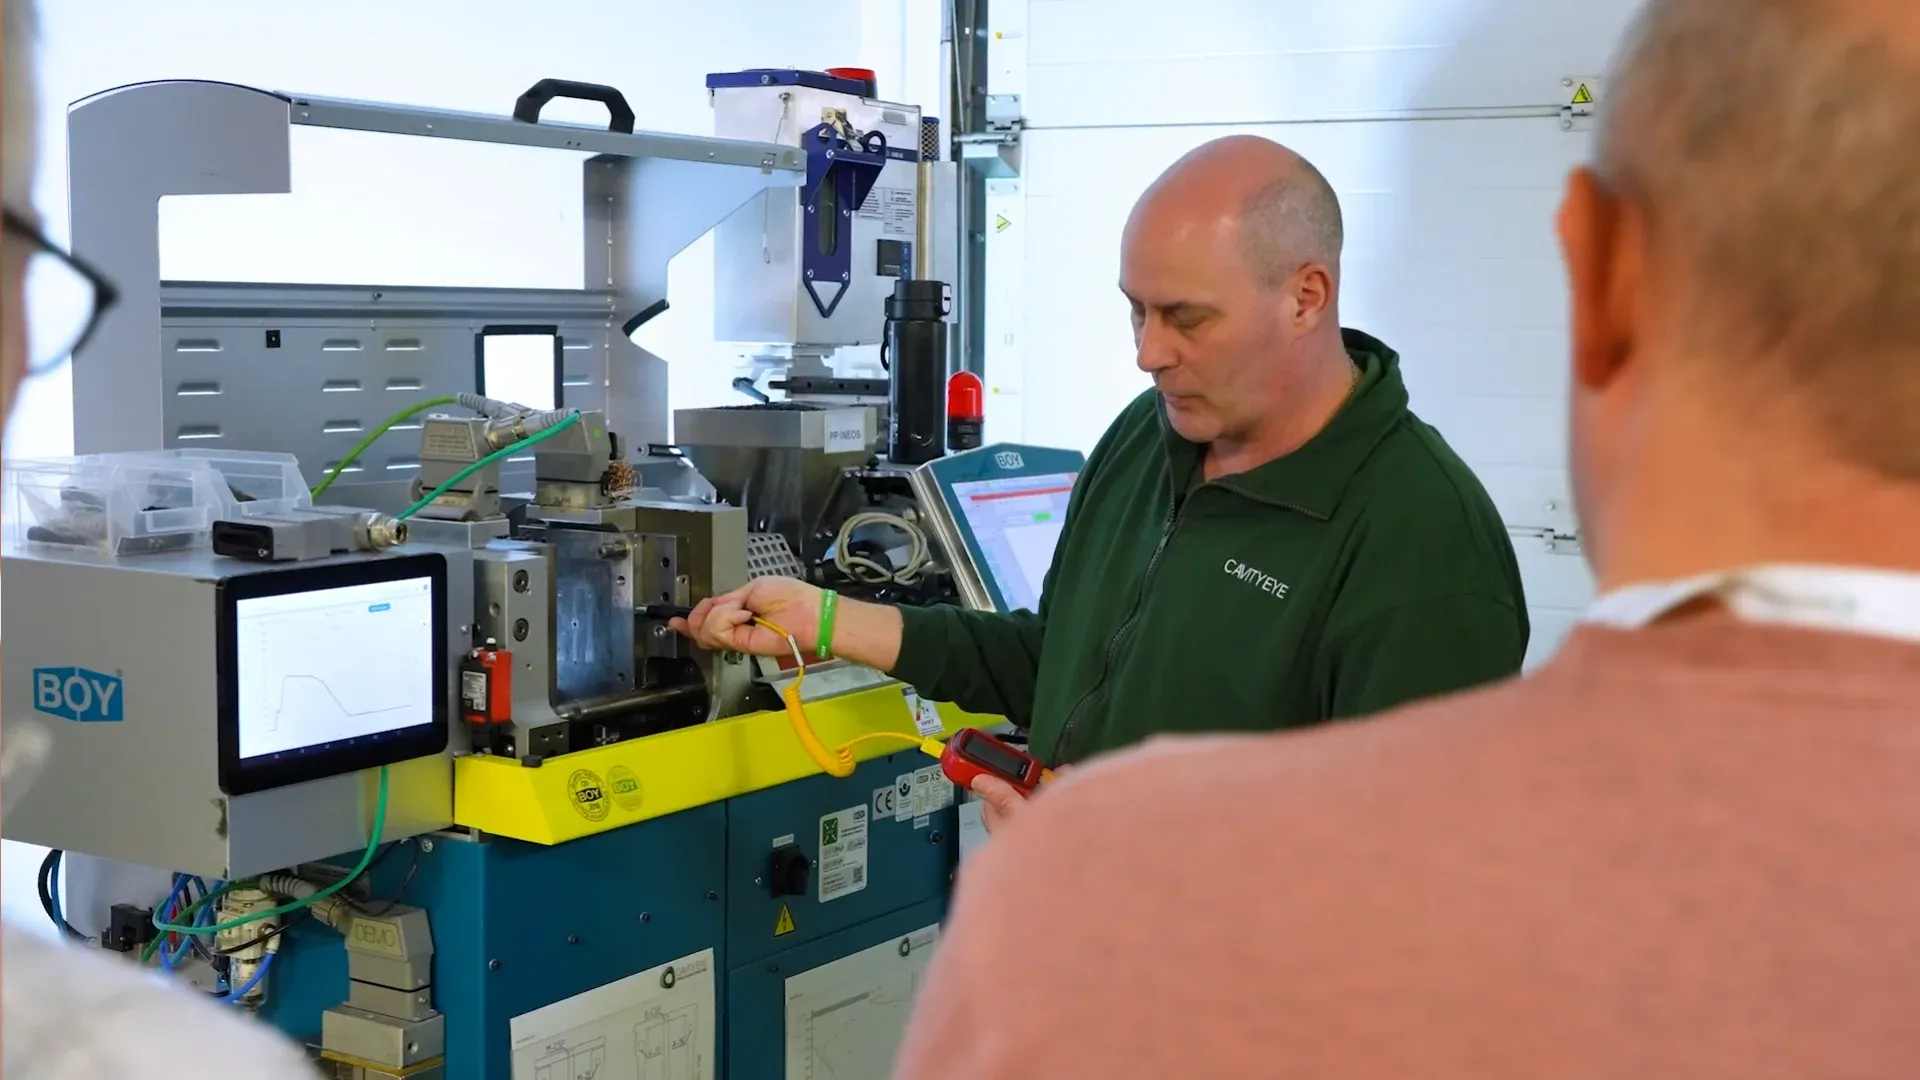
For the measurements we used the mold of an altered standard specimen. The inlet system of the mold can be equipped with inserts, so products can be manufactured by side, film, unilateral and bilateral gate. The thickness of the cavity is 4 mm. In both cavities the ejector pins are located at the beginning and at the end of the flow path, through them indirect measurement can be performed. Under the ejector pins we installed our self-developed π-cell pressure sensors. The measuring range of the sensors is 15 kN, which is necessary since the reaction force is approximately 7850 N in case of a 10 mm diameter ejector pin and 1000 bar cavity pressure. Thanks to the minimized signal-to-noise ratio the measured values are shown in rather big resolutions, so even a few N load can be measured accurately, and the characteristic is linear in the entire range. The sensors are not sensitive to temperature change. The signals were processed by “Cavity Eye” measuring system and software which were developed especially for industrial environment, but suitable for laboratory measurements too. The standard version of the instrument handles 8 channels – sensors – and can be expanded indefinitely. It contains many automated functions, for example electronic access, storage, and compression of all the measuring results, statistical evaluation, automated identification of the mold etc.
The analysis of injetion molding process
The cavity pressure and hydraulic pressure curves are more or less connected. The injection pressure clearly influences the cavity pressure, but the molding happens in the mold cavity, so we can only get correct information about the production process if the pressure is examined in the mold cavity. A general cavity pressure and hydraulic pressure curve is shown in Figure 1. The curve can be divided into several distinct sections, which are
- filling,
- packing,
- holding pressure,
- cooling [1].

Figure 1. Cavity pressure and injection pressure in function of time
In the filling phase the material flows freely in the cavity. The pressure required to maintain the flow is relatively small, and it primarily depends on the flowability of the material, speed of the melt front and cross-section of the flow. There are fundamental differences between the thin- and thick-walled products. The filling of thin-walled products with long flow path is more complicated, there is less time available, and in the filling bigger pressure formed in the mold cavity while the cooling time is also significantly shorter.
In the compression phase the mold cavity is entirely filling up with polymer melt. The material does not flow, so when it is slightly compressed, the cavity pressure is built up in 0,01…0,1 second. Compression basically means that we squeeze several percent more material into the mold cavity than it could contain on atmospheric pressure. (The compressibility of the material can be determined by p-v-T measurement.) After the compression there is a switchover to holding pressure, this means the real built-up injection pressure is reduced momentarily or within a specified “ramp” time to the holding pressure value. The “ramp” can be always set on a modern injection molding machine, which greatly perpetuates the process, since the PID control electronics is not able to handle steadily momentarily changes. The switchover is one of the most sensitive parameters of the injection molding process.
During the decrease of the material temperature, the specific volume is decreasing, this is compensated by the injected material in the holding phase. During holding phase decreasing, increasing, and possibly pulsing pressure profiles can be used. Leaving the holding pressure or setting it incorrectly can result in sink marks on the surface of the product or vacuum void inside the product. The holding time is useful until the sealing i.e., when the material temperature in the cross-section of the impediment is decreased under the yield or crystallization temperature then it solidifies and prevents the flow of material.
In cooling phase, the material continues to cool, the pressure in the mold cavity decreases, but due to the sealing the material does not flow. Therefore, the pressure decrease is approximately proportional to the decrease of the specific volume, i.e. the shrinkage of the product. The negative steepness in the cooling phase is proportional to the cooling speed.
One of the most important machine parameters is the switchover. In industrial environment the most common to set the switchover according to the path, which means that the switchover from speed control to the pressure controlled holding phase happens at a given screw path. In case of modern machines this position can be held with 0,001-0,01 mm accuracy. The fault of system is that it does not take into consideration the external effects on the filling process. In case of failure or slight wear of the non-return valve, the path of switchover will be constant, although the amount of the injected material will fluctuate in each cycle. The least common method is the switchover according to time. It has the benefit of being able to measure the time with extreme accuracy, therefore it can be used for control. The most effective method in terms of stability is to measure cavity pressure. The pressure sensor is located near the gate or far away from it. If it is located near the gate then the entire filling process is well traceable, if it is at the end of the flow path then the filling of the product can be checked. We get the most information if there are sensors both at the beginning and end of the flow path. This is especially important for thin-walled products. Since the goal is to produce the same product quality in every cycle, the largest stability can be reached by switchover based on cavity pressure, which means closed feedback [3]. Figure 2. shows the product manufacturing process.
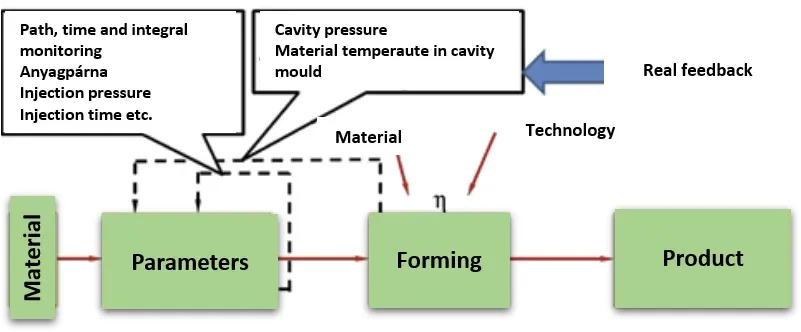
Figure 2. Flow chart of product manufacturing
Measurement results
For the experimental production a stable technology was set (Table 1.), compared to this the following parameters were changed:
- injection speed,
- material temperature,
- mold temperature,
- switching point,
- holding pressure,
- holding time.
Table 1. Technological parameters
| Material temperature | 200°C (240°C) |
| Mold temperature | 30°C (90°C) |
| Injection speed | 80 mm/s (40, 60, 100, 120, 140 mm/s) |
| Switching point | 10 mm (11, 9, 8, 7, 6 mm) |
| Injection pressure | 1500 bar |
| Holding time | 5 s (1, 2, 3, 4 s) |
| Holding pressure | 300 bar (100, 200, 400, 500, 600 bar) |
Figure 3. shows cavity pressure curves measured in one cycle. 2 sensors per cavity provide the signal, so in altogether 4 curves displayed belong together in pairs. The sensors were calibrated so the experienced differences of the pressure peaks can arise from the differences of the mold geometry. The previously mentioned four phases can be well separated.

Figure 3. Cavity pressure curves as function of time
By zooming in the rising section of the curve, the filling and compression phase becomes visible (figure 4). The melt reaches the sensors located near the gate in approximately 85ms, although measurable pressure appears only at the end of flow path, after 100ms. The measured pressure difference between the sensors (dp1 and dp2) in the filling phase is almost constant in a short section and proportionate to the material viscosity, the passed time between rising of two signals is proportionate to the injection speed (shear speed).

Figure 4. Cavity pressure curves as function of time
Table 2 summarizes the Δp and injection pressure values
Table 2. The Δp and injection pressure in function of injection speed
| Temperature | 200°C | 240°C | ||
| vfröccs [mm/s] | pfröccs [bar] | p1–p2 [bar] | pfröccs [bar] | p1–p2 [bar] |
| 40 | 380 | 40 | 334 | 34 |
| 60 | 426 | 45 | 384 | 41 |
| 80 | 462 | 54 | 391 | 45 |
| 100 | 495 | 60 | 415 | 48 |
| 120 | 523 | 61 | 438 | 50 |
| 140 | 548 | 63 | 458 | 54 |
The curves seen in figure 5 are similar to the flow curve [3]. The explanation for this is that the shear stress is determined by the pressure drop and flow geometry, while the shear speed comes from the flow volume and flow geometry. By increasing the injection speed, the measured pressure difference between the sensors is changing non-linearly, so the material viscosity is decreasing which can be measured on-line with the system. The effect of the material temperature on the flowability is unambiguous. Lower pressure was required to fill the mold cavity with higher temperature plastic. The registered injection pressure shows similar tendency, which has an entirely different explanation. The limit of the injection pressure set on the machine is 1500 bar. The measured pressure in the injection phase is significantly lower than this, which means that this parameter does not play a role in the forming, the real injection pressure can freely build up. The difference can be explained more by the reaction time of the machine, which changes between 0,01 and 0,1s according to the machine type. By increasing the speed of the screw piston, the inertia of the screw is increasing, i.e. it will stop later. The switchover was 10mm at all the settings, but the screw stopped later each time. Figure 6 shows the pressure curve of the 1. sensor in function of injection speed. (To make the comparison of curves easier, in the following we use the measured results of the 1. sensor.).

Figure 5. Δp values in function of injection speed

Figure 6. Cavity pressure in function of injection speed
At exact same parameters the injection speed has a significant effect on the cavity pressure. The specimens made at the speed of 120 and 140 mm/s have flash, which can be explained by the high cavity pressure. In case of flash it must be considered whether it was formed in the filling or the holding phase. In this case the impulse-like pressure surge slightly opens the mold, and the low viscosity melt forms flash. In cases like this, flash can be stopped unambiguously by decreasing the injection speed, the holding pressure does not affect it.
Changing the switching point brought similar results. At basic setting the switchover from injection pressure to holding pressure happens at the 10 mm position. If the switchover happened earlier, i.e. at 11 mm, holding pressure only slightly decreased. This means that the compression happened in the holding phase. If the switchover takes place later, then the injection speed shows the same phenomenon as before. Since the upper limit of the injection pressure was 1500 bar, the injection molding machine did not limit the real, built up injection pressure. Due to the late switchover flash was formed on the part (figure 7.).
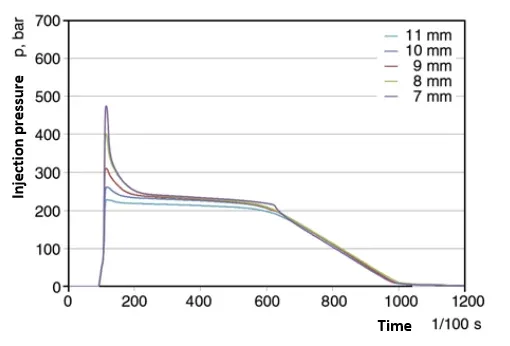
Figure 7. The effect of the switching point on the injection pressure
To analyze the process more precisely, it is worth examining the filling and compression phase a little more (figure 8.). The pressure curves measured in the filling phase are the same, the lines overlap. The switchover of 11 and 10 mm bend slightly due to the relatively early switchover. The curves are running together even in the compression phase, while the injection speed made the curve run-ups steeper or flatter. After switchover we use 300 bar holding pressure at all settings. The decrease of cavity pressure peak over time can be explained by the backflow of the material. There was a 200…250 bar cavity pressure until the sealing. This difference can be explained by the compressibility of the polymer, the not-Newtonian flow, and the structural changes in the flow cross-section during the cooling [4].
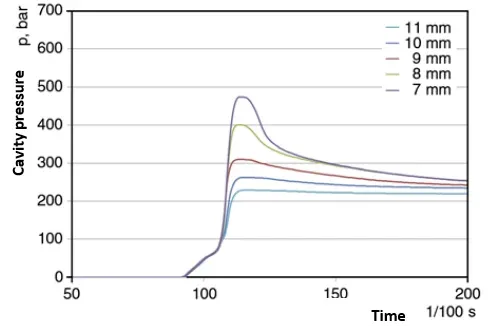
Figure 8. Effect of the switchover on cavity pressure
The holding time is usually determined by the mass measurement of the part. With cavity pressure measurement system, the effective holding time can be determined faster and more accurately (figure 9). Since all the parameters are constant, the curves run together until the end of the holding time. When the holding is shorter than sealing it can result in a sudden break, which is also the result of the free material flow. If the holding time is longer than the sealing time, it is not shown in the curve, because the material parts frozen in the impediment do not allow either inflow or outflow. After sealing – in the cooling phase – the steepness of the curves is approximately constant, which is analyzed in the cooling test.
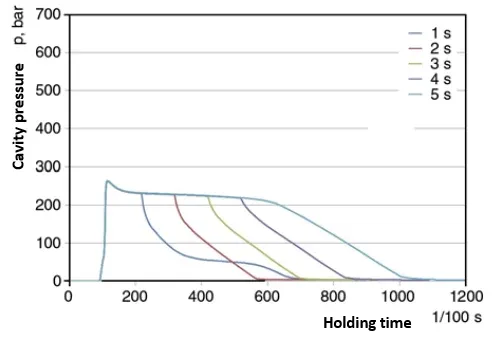
Figure 9. The effect holding time on cavity pressure
The testing of holding pressure brought very interesting results (figure 10). The cavity pressure is slightly lower than the set value. The reason for this was explained previously. When the holding pressure is lower than cavity pressure, then backflow forms in the gate and the pressure decreases. But when it is higher, then the compression is formed by holding pressure, reaching the pressure peak becomes slower, and it stays on the same value until the sealing.
At either of the settings there was no flash on the specimens, although the cavity pressure was significantly higher than during the change of injection speed. The reason for this is that the shell of the part is continuously cooling during the filling. When the temperature of shell layer decreases below crystallization temperature, then a solid shell surrounds the melt. Accordingly, the melted material cannot break through the shell, flow into the dividing plane, form flash. Consequently, at the production of thick-walled products the holding pressure value should be profiled in order to reduce the sink marks, recommended to increase it under time.
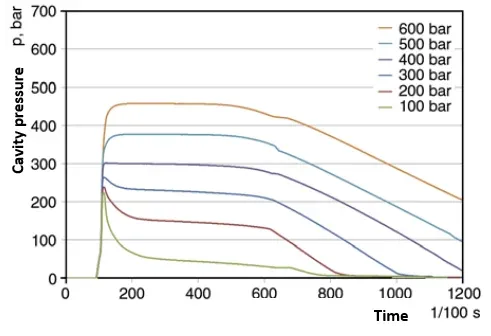
Figure 10. Effect of the holding pressure on cavity pressure
Figure 11. shows the effect of material temperature on cavity pressure. It is immediately apparent that by increasing the temperature of the plastic, the cavity pressure is increasing, and the sealing also happens more and more later. Above 230°C the 5 seconds long holding counts as short, the reason for this is the higher temperature melt seal later.
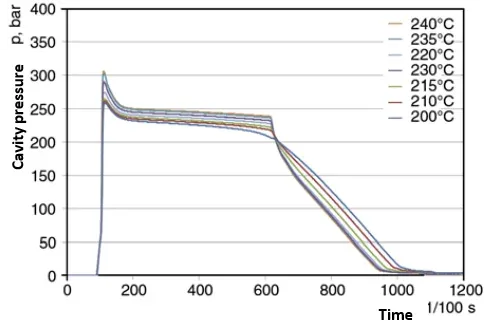
Figure 11. Effect of material temperature on cavity pressure
The function in Figure 12. are first derivative in time of the Figure 11. curves. It contains many interesting points in terms of process analysis. It shows well the influence of the material temperature on molding process. In the compression phase can be seen the first and the biggest peak in a positive direction, which a negative peak follows, this is proportionate to the outflow rate of the material. In the holding phase a negative steepness can be experienced, the pressure slightly decreases. The next negative peak results in a more significant change in function of temperature. Continuous transition is shown between the switchover and cooling, when the sealing happens, if the holding time is short, then there is a negative peak again. In cooling phase all the steepness is constant, since after the sealing the cooling speed does not change substantially.

Figure 12. First derivative in time of the cavity pressure curves at different material temperatures
The mold temperature influenced the curves similarly to the material temperature but did not increase the pressure peak in the same amount (Figure 13). By increasing the mold temperature, the sealing time shifts to later again. At 53°C the 5s holding time is not enough, the material flows out of the cavity even before the sealing happens. In the holding phase the pressure decreases less at a higher mold temperature. This can be explained by the slower cooling and the slower decrease of specific volume.

Figure 13. The effect of mold temperature on cavity pressure
By evaluating the derivative of Figure 13, the effective holding time and cooling speed can be verified (Figure 14). The higher mold temperature results in slower cooling, which is shown well on the diagram. The analysis of the derived function is used in the algorithm of the Cavity Eye control and interfering process, which is under development.

Figure 14. First derivative in time of the cavity pressure curves at different mold temperatures
Summary
As result of years of research, we developed a cavity pressure measuring system, which includes the development of the measuring cells, hardware components, and software. The instrument was created according to the industrial requirements, but it is suitable for laboratory measurements too. In our article we introduced the possibilities of pressure measurement and the conditions of the injection molding process. The measurement results demonstrate well how each technological parameter affects the four phases of injection molding. The analysis and control of the injection molding process with the curves and the first time derivate of the curves ensures further automatization possibilities. The use of the system can make production launch easier and faster. In case of the manufacture of faulty products, it helps to determine the cause of the problem, and to sort and separate the scrap due to the instability of the technology.
Bibliography
[1] Ming-Shyan Huang: Cavity pressure based grey prediction of the filling-to-packing switchover point for injection molding, Journal of Materials Processing Technology, 183, 419–424 (2007).
[2] Ho Yin Wong, Ka Tsai Fung, Furong Gao: Development of a transducer for in-line and through cycle monitoring of key process and quality variables in injection molding, Sensors and Actuators, A 141, 712–722 (2008).
[3] Szűcs, A.: Rheological and thermal analysis of the filling stage of injection moulding, eXPRESS Polymer Letters, 6/8, 672–679 (2012).
[4] Pantani, R.; Coccorullo, I.; Speranza, V.; Titomanlio, G.: Morphology evolution during injection molding: Effect of packing pressure, Polymer, 48, 2778–2790, (2007)