Introduction
In the first part of article about viscosity measurement, we described the theoretical background of the measurement. In the second part we share the measuring process to determine material viscosity in function of temperature and velocity using injection molding machine and support finding the appropriate injection speed for filling phase.
Measurement process
Before the start we need to ensure the raw material is dried, and the right nozzle is assembled. We check the predetermined cylinder temperature and dosing path for production, but it is better to take a bigger dose (3-4 D). The basis of the measurement is that we set the injection unit into rear position, and the melt is injected into the open at different injection rate, even at several material temperatures. We register the set velocity in cm3/s and monitor the pressure required for injection molding. On some machine types it is possible to use this exit function in automatic mode and the machine records the maximum pressure. On other machines we need to read from the control unit the current pressure value, which makes the measurement difficult. It is important to increase the pressure limit of the manual/automatic injection molding to at least 1000 bar. If the measured pressure reaches the 70 % of the pressure limit, we increase it further, so it does not affect the velocity of the screw and therefore the measurement.
Determine and record input parameters
To identify the measurement, it is recommended to record the following basic data:
- Injection molding machine identification, type
- Material type, drying time
- Injection screw diameter
- Dose size
The variable input parameters required for the measurement is summarized in Table 1. To determine the different setting possibilities, we use the recommendations of the material datasheet (cylinder temperature), and the injection rates used in practice as a starting point. The injection rate can be changed quickly, so we recommend using 3-8 setting in the range 10-80% of the machine’s maximum injection rate. It is important to know the maximum dose size to determine the maximum velocity. The following general formula can be used for this:

Table 1. Input data used for measurement (example)
| Nozzle geometry | Cylinder temperature (every zone) | Injection rate (% of maximum velocity) | |||
| Length | Radius | Nozzle | Cylinder 2 | Cylinder 1 | 10, 20, 40, 60, 70, 80 % (taking the dose into account) |
| 4, 8, 16 mm | 1.25 mm | -10 °C, Original profile, +10 °C | |||
When we determine the velocities, we need to consider the machine ability and the time required to read the data. For example, if we set a velocity which the injection molding machine cannot keep or there is not enough time to read the data, we should decrease it. The set and real injection rate can be obtained from the first time derivative of the screw movement, which can be visually displayed on the injection molding machines (Micrograph).
Record output parameters
For the measurement we dose with injection molding machine (back pressure decreased to zero) to at least 3-4D position, then we read the measurable pressure in manual mode. The goal is to record an average value, this can be read in the stabilized phase. The reading accuracy will decrease with the increase of injection rate.
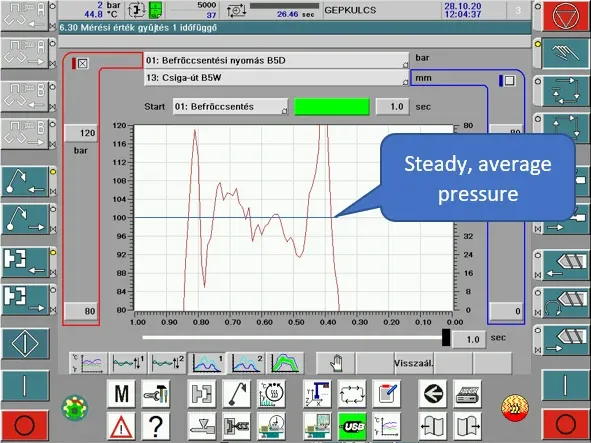
The basic measurement data in our case
| Person performing the measurement | Ádám Kiss |
| Date | 28.10. 2020 |
| Machine identification | CEHU1-BOYXS-10T |
| Material identification, drying | PA66 – 70G30HSL NC010, 4 hours, 80°C |
| Injection cylinder diameter | D14 mm |
| Dose size | 6 cm3 |
Input data used for measurement
The maximum dose size for our injection molding machine is 6 cm3, so using the previous formula the maximum injection rate is 12 cm3/s. This empiric value helps us to read the result more easily.
| Nozzle geometry | Cylinder temperature | Injection rate | |||
| Length | Radius | Nozzle | Cylinder 1 | Feeding | 1 cm3/s |
| 4 mm | 1.25 mm | 275 | 275 | 40 | 2 cm3/s |
| 8 mm | 1.25 mm | 285 | 285 | 40 | 5 cm3/s |
| 16 mm | 1.25 mm | 295 | 295 | 40 | 8 cm3/s |
| 10 cm3/s | |||||
Evaluation of measured data – Effect of material temperature on viscosity
The results are summarized in table format in function of the injection rate. The measurement was done at 3 different nozzle geometry (length), so different tables contain the data.
Table 2: Pressure in function of injection rate and temperature, with 4 mm long nozzle
| Vfrcs [cm3/s] | 275°C material [bar] | 285°C material [bar] | 295°C material [bar] |
| 1 | 212,00 | 200,00 | 160,00 |
| 2 | 250,00 | 230,00 | 205,00 |
| 5 | 295,00 | 275,00 | 240,00 |
| 8 | 330,00 | 315,00 | 260,00 |
| 10 | 390,00 | 340,00 | 280,00 |
First step is to make an injection rate – injection pressure diagram from the measured data.
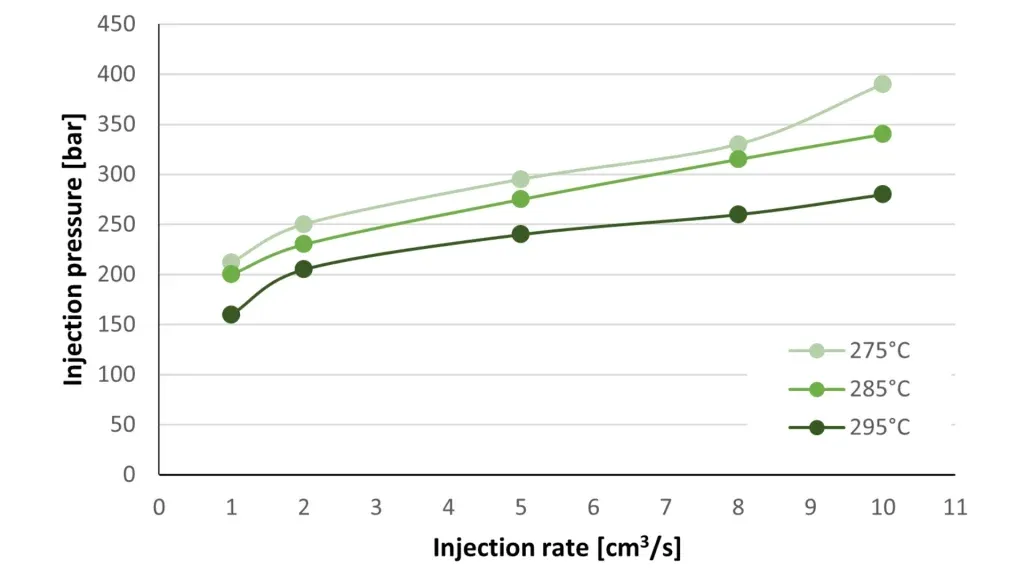
Increasing the injection rate, the injection pressure will also increase, although the degree of pressure increase is continuously decreasing. At 5 cm3/s injection rate 250 bar pressure is required, increasing the velocity, at 20 cm3/s injection rate 550 bar pressure is required for the injection molding. So, although the injection rate is increased to four times of its original value, the required pressure value increases only to its double, this can be explained with the polymer’s pseudoplastic behavior.
In practice the ratio of the pressure and velocity is usually illustrated as function of velocity, this shows the shearing sensitivity of the material. The more the viscosity decreases with the increase of velocity, the more the ratio of pressure and velocity decreases.

Using the data of measured pressure and nozzle geometry the apparent shear velocity, apparent shear stress and apparent viscosity can be determined. The flow curve shows the shear stress in function of the shear velocity. The material’s shearing sensitivity exponent can be obtained by fitting a straight line following the power of law to the results.
In practice it is recommended to fill the cavity the shortest possible time, so with the biggest injection speed possible (machine, material, product quality). The increased injection speed results in decreased viscosity. The high speed allows for the heat transfer between the mold and the injected material to decrease, therefore the cavity pressure can be reduced during the filling process. In case of molds with thin inserts, the number of insert breakage and lifespan of the mold can be improved.
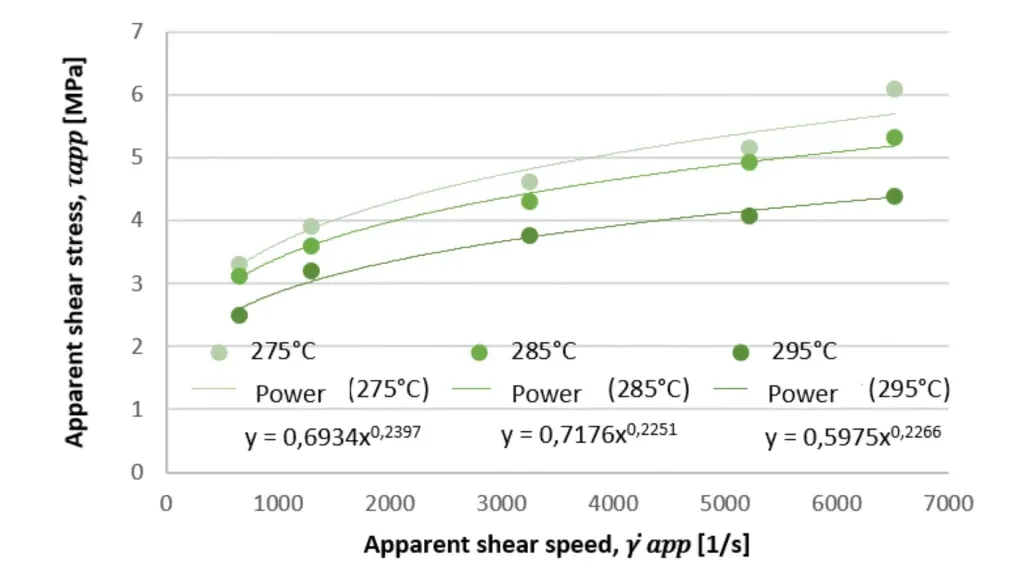
The shear stress factor was n=0,24 at the material temperature of 275°C, which is in line with the value found in the literature. So, at this material, increasing the injection speed significantly decreases the viscosity. If this value is near to 1, then increasing the injection speed does not decrease the viscosity. By increasing the material temperature to 295°C, the shear stress factor changed to n=0,227. It can be stated that this material becomes slightly more sensitive to shear speed at increasing the material temperature. At higher temperatures the viscosity decreases more by the increasing injection speed than at lower temperature.
Based on the viscosity curve there are two things to be considered. The stability of the injection molding process and the beneficial effects of the reduced viscosity. It is recommended to set the injection speed where the viscosity reaches the minimum value, but the injection molding machine is still able to repeat the process stably. If the injection speed is high, then at the change of viscosity the measurable pressure increase/decrease will be smaller, than at a smaller injection speed. Showing this through a concrete example, if the viscosity is examined at the apparent deformation speed of 1300 1/s (2 cm3/s) and ±100 1/s, then the possible change is in the range of ~500 Pa*s. If the injection speed is increased to double, then this change is in the range of ~200 Pa*s. Higher speed can help to increase the stability of the process.
In Part 3. we will continue the evaluation of results and examine effect of nozzle length on the molding process.