Introduction
The number of plastic products used in the industry is increasing day by day, and with the development of the technical polymers it became possible to replace some of the metal and other (non-polymer) material products. At the moment, the automotive industry has the most definitive effect on the market, especially with the appearance of electric vehicles. In the last 50 years the weight of the polymer product used in vehicles has increased about 10-15%, a modern car contains more than 400 kg polymer-based material [1]. To meet the increasing quality requirements for these mostly injection molded parts, new technical solutions are needed in process control and production. With modern electronic injection molding machines process capability and production efficiency can be significantly increased compared to an old hydraulic model. To achieve low production cost and environmentally conscious material consumption require decreasing product weight and the use of recycled materials. Productivity can be increased with multiple cavity molds (32-64) and hot runner system. To meet the high mechanical requirements, it is necessary to use materials with a large amount of additive (mainly flame-retardant, amplifier), especially in the case of small precision parts with thin walls (under 1-2 mm). Therefore, the complexity of the injection molding process is greatly increasing. It became more complex to determine, set and maintain the injection molding technology and to perform the debugging processes. The injection molding machine is not capable to monitor all the differences between the cavities, which can lead to the dispersion of mechanical properties [2-3,5,8].
In the injection molding process one of the important factors are the wall thickness and flow path length. Decreasing the wall thickness increases the required filling pressure. In case of products with long flow path the pressure greatly increases, and it can show even exponential characteristics [9]. During the flow of polymer melt a shell-core structure is formed, its ratio depends on the wall thickness, flow rate, material, and mold temperature (Figure 1). Entering the cavity the melt front forced towards the wall, where it instantly freezes when touches the wall and an outer, small cross-sectional oriented shell is formed. Moving toward the center of the cross-section, after the shell layer a strongly oriented, sheared layer is formed, where the molecular chains are settled according to the direction of flow. The cause of the arrangement is the speed difference. The flow rate at the wall is zero, thus significant stretching-shearing forces are formed in the shear layer. In this layer the arrangement of molecules and fillers gives mechanically advantageous properties if the direction of the load and the flow are the same. Moving away from the wall the shearing force decreases until the center line of the flow. The orientation usually has no or only a small effect in the center line of the product’s cross-section, i.e. in the core layer, where the melt flows plug-like.

Figure 1. Unfolding flow and forming of shell-core layer [4]
Reducing the wall thickness (1-2 mm) means a significant reduction in the size of the core layer, which can cause a change in the ratio of the layers and the appearance of orientation even in the whole cross-section of the product. Because of the low wall thickness the importance of filling time increases. The shorter the filling time is the less cooling can take place therefore the flow cross-section stays the appropriate size for the filling of the product. There is always heat generation in the shearing layer, which changes proportionately with the increase of speed [4,5,6]. In case of low wall thickness this is especially significant, but it has a smaller effect on the products with thick walls (<4-5 mm).
The injection molding process can be divided into three subprocess based on their physical behavior:
- flow (filling),
- compression (pressure boost), and
- heat removal (cooling)
The flow process lasts until the mold cavity is filled 100%, after that the compression of melt starts. The pressure measured during the flow and the force required for maintaining the flow determined by the viscosity curve. This depends on the material properties (temperature, molecular weight), mold (geometry, temperature) and technology (deformation speed). After the filling is complete, the compression of the material starts, the material behavior is determined by the pvT curve. The difference of the internal pressure peaks formed during compression can be determined based on the change of ratio of the frozen layer between the beginning and end of flow path and on the force, which maintains the flow [7,8].
The goal of this series of experiments is to analyze what happens during the injection molding of thin-walled products and in the mold. The main focus is the injection rate and mold temperature.
Used materials and equipment
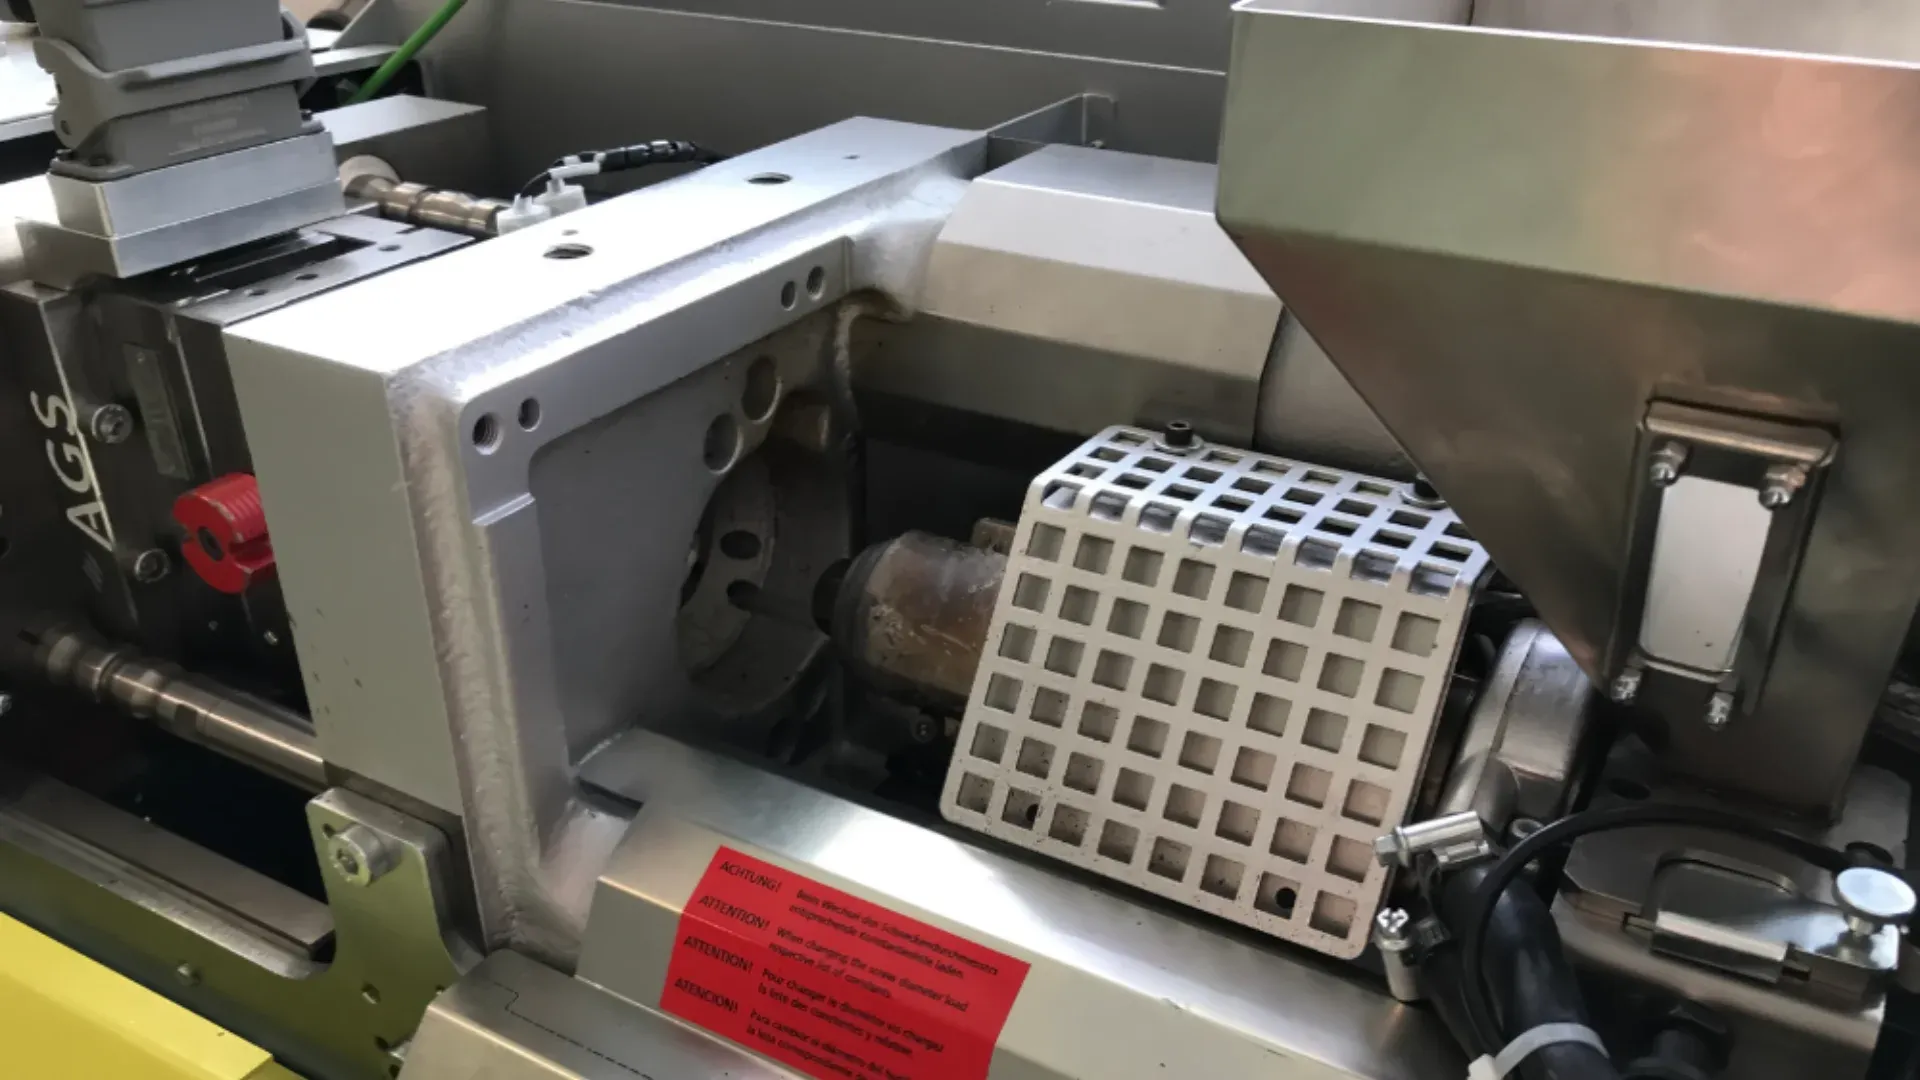
For the measurements we used Hostalen GC 7260 (MFR: 190 °C/ 2.16kg, 8.0 g/10 min) polyethylene on 240°C cylinder temperature. The material temperature was verified with mantle thermocouple, it was 237°C in cyclic mode. The measurements were made with a hydraulic Boy injection molding machine. The clamping force of the machine is 10t, maximum dose is 6.2 cm3, diameter of screw is 14 mm. To control the mold temperature, we used Witmann tempro basic C90. The temperature, flow rate and pressure of the water were checked with our self-developed waterflow measuring system. The flow rate on the mold is 5.2 l/min per side, the difference between the set temperature on the tempering device and the real temperature is 2.1°C.
Experimental method
We used a two-cavity mold with replaceable inserts to perform the measurements. The wall thickness and gate can be easily changed. The product’s wall thickness can be modified between 0.5 and 2 mm. By default, the product is filled through a 0.5 mm thick film inlet. Cavity Eye pressure sensors were built into the mold. Altogether there are 6 sensors in the mold, in order in the distribution channel (before gate, CSF, CSA), beginning of flow path (7mm from gate, 1F, 2A) and the end of flow path (7 mm from the end of the product, 1A, 2F).

Figure 2. Mold with variable wall thickness (left) and the product (right) used for the experiments
Result evaluation
The measurements were performed with two different wall thickness. The modified parameters of injection molding technology are summarized in Table 1. We completed the measurement with both wall thickness, but only the results of 1 mm wall-thickness were analyzed in detail. When the injection rate and mold temperature were changed, the other parameters like dosing, cycle time, holding pressure, holding pressure were kept constant. The target internal pressure peak was between 500-600 bar based on the sensor near the gate.
Table 1. Measurement plan
| Wall thickness | 1 mm, 2 mm |
| Injection rate | 120 mm/s, 60 mm/s, 30 mm/s, 15 mm/s, 12 mm/s |
| Mold temperature | 30°, 90° |
| Material temperature | 240° |
| Holding pressure | 600 bar |
| Holding pressure time | 3 s |
Choosing the right switching point the four phases of injection molding can be easily differentiated: filling, compression, holding and cooling. When we analyzed the pressure curves, we split the data in two. For the measured values during filling (flow) and for section after the complete filling (compression, holding, cooling) (figure 3). A well discernible steepness change can be seen in the measured values at the end of filling phase and at the beginning of compression. In the moment of compression, the pressure increase (steepness) is mainly in correlation with material properties not with the ratio of shell-core layer (for example: compressibility, molecular weight).

Figure 3. Internal pressure in function of time, sensors in the first cavity, before gate (CSF), in the cavity near the gate (1F), and at the end of flow path (1A).
The speed of pressure increases in the compression phase (boost pressure) varies at the different points of the cavity (beginning and end of flow path). One of the reasons for this is the thickness of the frozen shell layer, which is proved by tests performed at different injection rates. Increasing the injection rate, the difference of the measured pressure increase (steepness) value after the filling is decreasing between the beginning and the end of flow path. Increasing the injection rate at a low wall thickness (1mm) results in a decrease of the pressure required for filling in the cavity (figure 4).

Figure 4. Cavity pressure curves in function of injection time, in order 120mm/s. 60 mm/s, 30 mm/s, 15 mm/s and 12 mm/s. Marked with blue is the sensor at beginning of flow path and with orange at the end of flow path.
On the other hand, on the injection molding machine the measurable pressure increase cannot be monitored clearly when increasing injection rate, which can trace back to the flexible properties of the melt and the place of the measurement. Increasing the injection rate in case of the specimen with 2 mm wall thickness, increasing the filling pressure. Reducing greatly the wall thickness this phenomenon is reversed, because of the short injection time and reduced viscosity the cavity is easier to fill (figure 5). The cavity of molds that produce small products, is often jointed and divided. Less robust mold inserts suffer less load and therefore less deformation with increased injection rate, which contributes to increase the lifespan and helps to avoid possible insert breakage.

Figure 5. The pressure required for filling the cavity in function of injection rate – sensor near gate, specimens with 1 and 2 mm wall thickness.
Changing the wall thickness from 1 to 2 mm results in fivefold increase of filling pressure by 12 mm/s, while it reduced to half by 120 mm/s injection rate. Using 2 mm wall thickness the pressure increased from 100 bar to 175 bar, meanwhile in the case of 1 mm wall thickness it decreased from 560 bar to 475 bar with the increase of injection rate. Increasing the wall thickness, the material deformation decreased, therefore the expected pressure reduction changes at the same filling speed but variable wall thickness. The general formula of apparent deformation rate:

where Q [m3/s] is melt volume, h [m] is slit thickness (wall thickness), W [m] is slit width. The developed deformation rates are summarized in Table 2.
Table 2. Deformation rate in function of wall thickness
| Injection rate [mm/s] | 1 mm wall [1/s] | 2 mm wall [1/s] |
| 12 | 2216 | 554 |
| 15 | 2770 | 692 |
| 30 | 5541 | 1385 |
| 60 | 11083 | 2770 |
| 120 | 22167 | 5541 |
It is visible that the twofold increase of wall thickness causes a change in melt velocity. To achieve the same velocity with 2 mm wall thickness, the velocity should increase fourfold compared to the 1 mm wall thickness. By increasing the injection rate, the difference of measurable pressure peaks between the start and end position of the cavity is decreasing at both wall thickness (figure 6). The differences decreased from 165 bar to 78 bar at 1 mm wall thickness, and from 60 bar to 20 bar at 2 mm wall thickness.

Figure 6. The difference of measured pressure peaks at the beginning and end of flow path in function of injection rate – at 1 and 2 mm wall thickness, 30°C mold temperature
The analysis of pressure integrals originated from the measured pressure values were split into two parts. The pressure integral is the sum of area under the measured curve per cycle based on a sensor located at the beginning and end of flow path. The first part is from the beginning of injection molding till the complete filling, the second is from the beginning of compression until the set holding time (3s). Based on the measured pressure integrals until the filling the increase of injection rate means decrease in integral value at both wall thickness (figure 7). The measurable pressure integral in the filling phase depends mostly on filling time, mold resistance and material viscosity. The integral of the filling phase demonstrates the change of material viscosity well, but it is not affected much by the mold temperature. Any change caused by material temperature or degradation can be easily proven. The halved injection rate results in a more than twofold increase of the filling pressure, which proves the material’s pseudoplastic behavior. The bigger deformation rate means lower viscosity and lower pressure. The shear sensitivity factor describes this phenomenon well. The more it nears 1 (for example PC, ~0.9), the more the material shows linear behavior between the deformation ratio and shearing stress. The integral values measured with sensors located at the end of flow path are near zero until the moment of filling. This can be explained by the fact that the sensor is located only 7 mm from the end of flow path, so the melt flow and the pressure increase can be followed only for a short time in the filling phase. At the evaluation we considered the sensors at the beginning of the flow path, which are located 7 mm after the gate. Increasing the wall thickness results in a decrease of integral values at same injection rates. If the injection rate is increased, the differences due to wall thickness are decreasing.
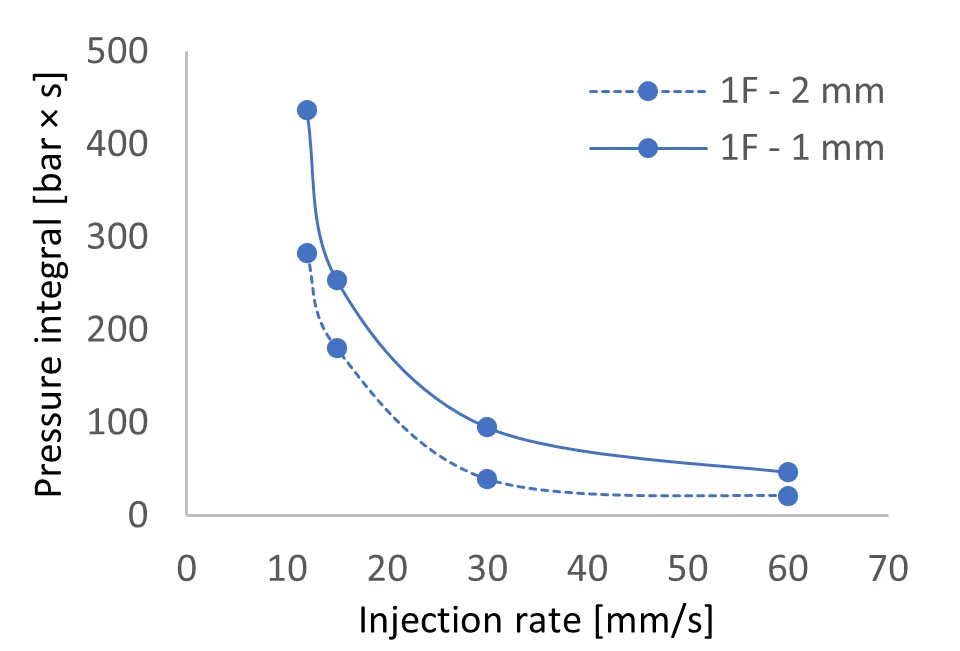
Figure 7. Injection molding integral values until the moment of filling in the function of injection rate – 1 and 2 mm wall thickness
Examining the pressure integral from the beginning of compression, except for the 12 mm/s of speed, there is small amount of change when increasing the injection rate. A few percent (3-10%) increase of the measured pressure integrals happens in the interval of 15 and 60 mm/s. The difference between the integral values measured at the beginning and end of flow path is around 8% at 2 mm wall thickness, while at 1 mm wall thickness the value is almost threefold (figure 8).
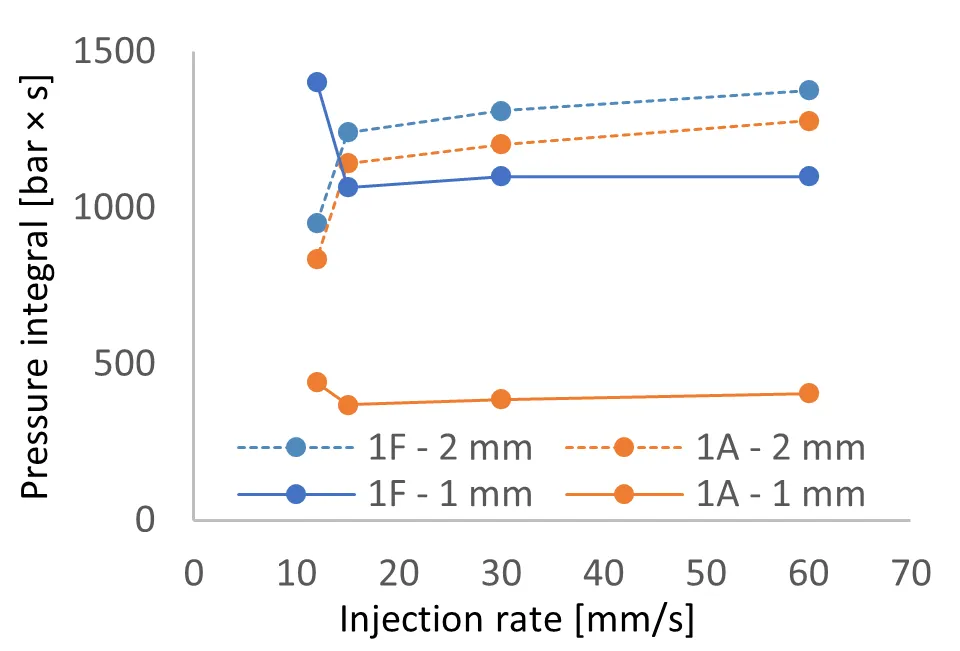
Figure 8. Values of injection molding integrals after the moment of filling in function of injection rate – mold temperature of 30°C
The measurable integral value at the beginning of flow path is always bigger than at the end of flow path. The discrepancy is caused by different ratio of the formed shell layer at the beginning and end of flow path, pressure drop, and the continuous decrease of melt temperature. The different pressure rundowns at certain points of the cavity can result in different injection molding product properties. The density, orientation and other attributes are different at the beginning and end of flow path. These differences intensify with decreased wall thickness and increased flow path length.
The effect of the mold temperature increases significantly with the decrease of wall thickness. In case of 2 mm wall thickness, the differences were much smaller than at 1 mm wall thickness. The increase of mold temperature reduces the cooling rate, therefore during the flow of material the shell layer is formed with a much smaller cross-section, and the holding pressure appears more forcefully on the measured internal pressure curves (figure 9). The better enforceability of the holding pressure generally results in better accuracy to size and more favorable mechanical properties.

Figure 9. The effect of mold temperature to the cavity pressure on the mold temperature of 30°C and 90°C at 1 mm wall thickness
The smaller cooling speed and shorter filling time results in smaller cross-sectional frozen shell layer, therefore the pressure differences are smaller (figure 10). At high injection rates the mold temperature effects only to a small extent the formed pressure peak differences (6 bar).

Figure 10. Difference between the maximum pressure values in function of injection rate – 1 mm wall thickness, 30°C and 90°C mold temperature, sensor at the beginning of flow path
Using high injection rate, we can achieve more homogeneous product properties, small mold temperature can be used (high cooling speed) achieving shorter cycle time. The temperature had only small effect to the pressure integral measured until the filling point, especially at low injection rate (figure 11). Increasing the injection rate, the differences almost entirely disappeared, which proved that the filling time minimizes the effect of mold temperature. Thus, the filling phase is not affected significantly by the mold temperature, if the filling time does not cause the material to freeze. The mold temperature causes only a minimal deviation in the thickness of the formed shell layer in case of a sufficiently short filling time. On the pressure values measured in the filling phase, the material temperature, filling speed and change of molecular weight have a significant impact.
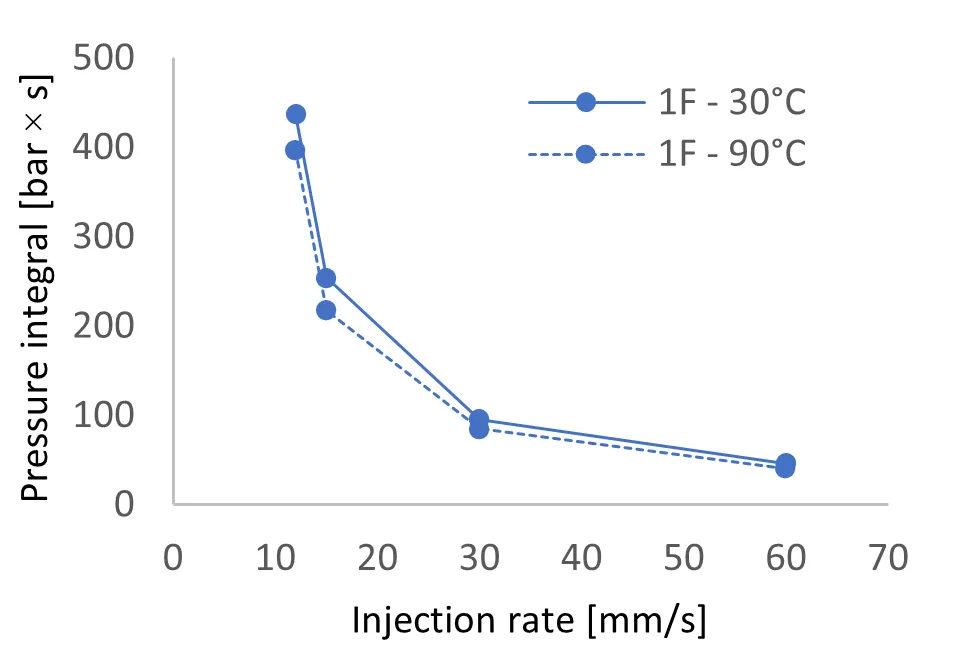
Figure 11. Injection molding integral values until the moment of the filling in function of injection rate – 1 mm wall thickness, 30°C and 90°C
Examining from the beginning of compression until the end of holding, the pressure integrals are increasing a small amount (3-10%) together with the injection rate. Exception is the speed of 12 m/s, which can be traced back to machine uncertainty. The increase of mold temperature caused the increase of pressure integrals at increasing injection rate (figure 12). Partly because of reduced cooling speed, the holding pressure can be kept for a longer time. By increasing the temperature, the integral difference measured between the beginning and end of flow path decreased at 1 mm wall thickness. In many cases this results in better product quality, but it requires longer cycle time.

Figure 12. Injection molding integral values after the moment of filling in function of injection rate – mold temperature of 30°C and 90°C
The effect of the change in the mold temperature appears best from the beginning of the compression phase. Increasing the mold temperature from 30°C to 90°C during continuous production we can see the change in the pressure curves. The injection rate was 30 mm/s, the wall thickness was 1 mm. It took 10 minutes and 18 cycles for the temperature to set in. In the filling phase the curves did not change considerably. From the beginning of compression until the end of holding the pressure integral increased significantly, more so in the beginning than at the end (figure 13).

Figure 13. Pressure change measured during heating – 1 mm wall thickness, heating from 30°C to 90°C under 12 minutes
In the heating phase, from the beginning of compression until the end of holding we recorded the pressure integrals in function of the passed cycle. During the heating, the temperature and pressure integrals show approximately linear characteristics. The steepness of the increase of pressure integrals is different when measured at the beginning and end of flow path. The differences and steepness of the increase give feedback about the effect of holding pressure in function of mold temperature (figure 14).
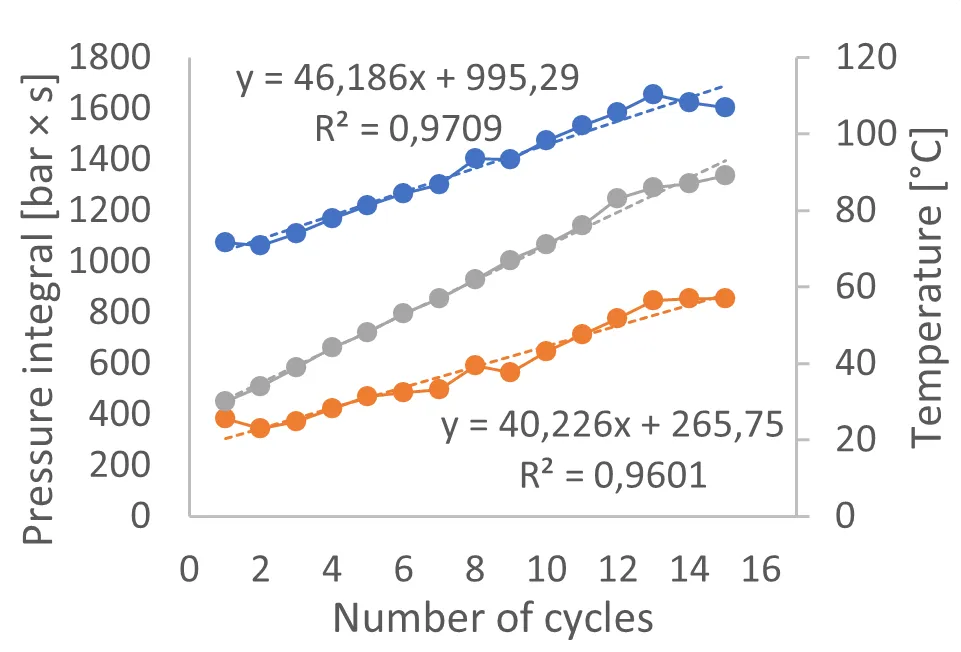
Figure 14. During heating the pressure integral values measured from the beginning of compression in function of the number of cycles, where the sensor located at the beginning of flow path (blue), at the end of flow path (orange), temperature of tempering device (grey) – at 1 mm wall thickness and injection rate of 30 mm/s.
Summary
One of most definitive factors of the injection molding process is the ratio of the length of flow path and the wall thickness. The higher this ratio is, the harder it is to control the process and ensure its stability. The right process control is essential for the scrap-free production of products with continuously decreasing wall thickness and high-quality requirements. The effect of the filling speed and the mold temperature significantly change, when the wall thickness is around 1 mm. We proved that at thin-walled products the mold temperature has no considerable effect in the filling phase if the filling speed is fast enough, however there are significant differences in the holding phase. Increasing the mold temperature greatly improves the sustainable holding time and pressure value, and it reduces the measured differences at the beginning and end of cavity. At 2 mm wall thickness the measurable pressure differences at the beginning and end of flow path are much smaller, the effect of the temperature and filling speed is less dominant. At small wall thickness the internal pressure decreases by increasing the injection rate, in contrast to the pressure values shown on the machine. The pressure measurement technology greatly contributes to process understanding and monitoring, which can only be done to a limited extent with the injection molding machine.
Horváth Szabolcs
Cavity Eye Hungary Kft
Budapest University of Technology and Economics, Faculty of Mechanical Engineering, Department of Polymer Engineering – PhD Student
Bibliography
[1] Pradeep, Sai Aditya – Automotive Applications of Plastics: Past, Present, and Future, Applied Plastics Engineering Handbook 651–673, (2017)
[2] Horváth Szabolcs, Vámos Dániel, Boros Róbert, Szűcs András – Átkapcsolás hatása a fröccsöntési folyamatra és a szerszámnyomásra, POLIMEREK 3 : 4 pp. 125-128. , 4 p. (2017)
[3] Szűcs András, Belina Károly – Vastagfalú termék leképezésének analízise “Cavity Eye” belsőnyomás mérőrendszerrel, MŰANYAG ÉS GUMI 50 : 2 pp. 72-77. , 6 p. (2013)
[4] Suhas Kulkarni – Robust Process Development and Scientific Molding, Robust Process Development and Scientific Molding (Second Edition), Hanser, 2017, Pages I-XXII, ISBN 9781569905869
[5] László Halász – Control methods in polymer processing, Volume 10, 1-477 (1993)
[6] Halász László, Zrínyi Miklós – Bevezetés a polimerfizikába, Műszaki Könyvkiadó, Budapest, (1989)
[7] Tari Gábor, Szabó Ferenc, Suplicz András – Áramlási egyenetlenségek valós idejű elemzése fröccsöntő szerszámban, POLIMEREK 5 : 3 pp. 424-428. , 5 p. (2019)
[8] Szűcs András, Horváth Szabolcs, Vámos Dániel – Fröccsöntő szerszámok validálása, mester technológia beállítása I., MŰANYAG- ÉS GUMIIPARI ÉVKÖNYV 16 pp. 65-70. , 6 p. (2018)
[9] Horváth Sz., Szűcs A – Determining apparent melt viscosity by cavity pressure, SPE Antec 2019 Conference, Detroit, USA 1-5, (2019)